Introduction
In order to gain some knowledge about Grafana, InfluxDB and Telegraf I did a basic installation. Grafana and InfluxDB were installed on a CentOS 7 server. The Telegraf agent was installed on a separate CentOS 7 server (which also hosts petersplanet.nl by the way).
Versions:
InfluxDB: 1.7.1
Grafana: 5.3.4-1
Telegraf: 1.8.3-1
InfluxDB
All installation activities will be done as root.
# Get the software
wget https://dl.influxdata.com/influxdb/releases/influxdb-1.7.1.x86_64.rpm

# and install
yum localinstall influxdb-1.7.1.x86_64.rpm
systemctl enable influxdb
systemctl start influxdb
systemctl status influxd
TCP port 8086 is used for client-server communication over InfluxDB’s HTTP API
TCP port 8088 is used for the RPC service for backup and restore
You can view the current configuation with:
influxd config
The configuration file can be found in: /etc/influxdb/influxdb.conf
Let’s create a database and make it secure. Create an admin user with all the rights and a user used by Telegraf.
influx -precision rfc3339
> CREATE DATABASE "MONITORDB"
> SHOW DATABASES
> CREATE USER "admin" WITH PASSWORD 'secret' WITH ALL PRIVILEGES
> CREATE USER "monitor" WITH PASSWORD 'secret'
> GRANT ALL ON "MONITORDB" to "monitor"
> SHOW GRANTS FOR "monitor"
> SHOW USERS
After that set auth-enabled = true in influxdb.conf and restart influxd
For this demo we will skip the retention policy but usually you will need to set that as well.
Grafana
# Get the software
wget https://s3-us-west-2.amazonaws.com/grafana-releases/release/grafana-5.3.4-1.x86_64.rpm

# and install
sudo yum localinstall grafana-5.3.4-1.x86_64.rpm
systemctl enable grafana-server
systemctl start grafana-server
systemctl status grafana-server
The configuration can be found in: /etc/grafana/grafana.ini
Now you should be able to login to Grafana with a web browser.
URL: http://<your-server>:3000/
username: admin
password: admin
Create a datasource after changing the default password.
Name: monitords
Type: InfluxDB
Database: MONITORDB
username: secret
password: secret
Next thing we need to do is to install and configure a Telegraf agent on a server we would like to monitor.
Telegraf
# Get the software
wget https://dl.influxdata.com/telegraf/releases/telegraf-1.8.3-1.x86_64.rpm

# and install
sudo yum localinstall telegraf-1.8.3-1.x86_64.rpm
systemctl enable telegraf
systemctl start telegraf
The configuration file can be found in: /etc/telegraf/telegraf.conf
We will need to change some settings to be able to communicate with the InfluxDB database.
Change in telegraf.conf:
[[outputs.influxdb]]

urls = ["http://<your-influxdb-server>:8086"]
database = "MONITORDB"
username = "monitor"
password = "secret"
After that restart influxdb
Now some basic inputs will be send to the Influx database. You can check this in InfluxDB.
influx -precision rfc3339
> auth
> use MONITORDB
> show MEASUREMENTS
> select * from CPU
> select * from system
> show series
Result
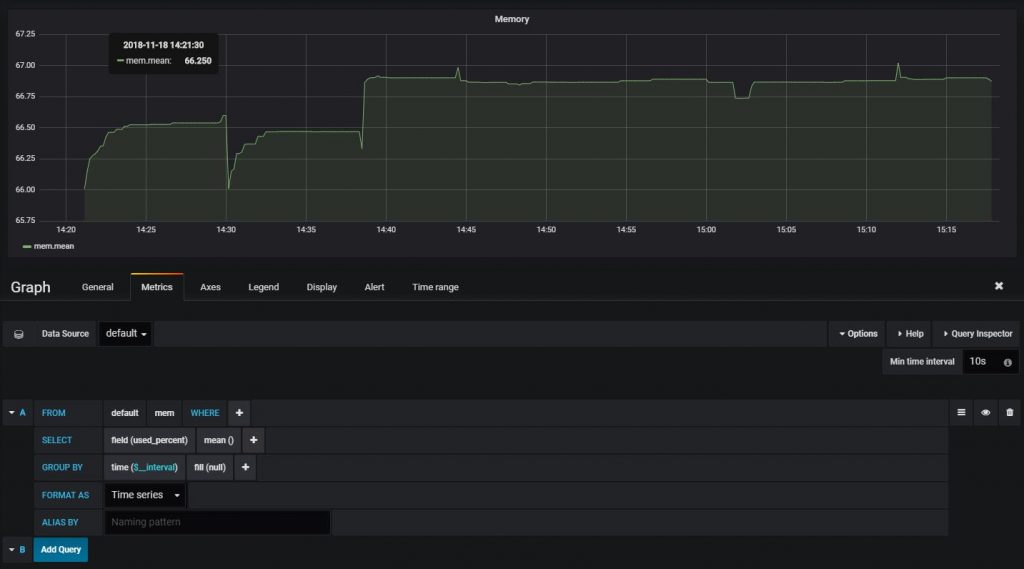
Next thing is to make all of this visible in Grafana.
Create a new dashboard, add Panels to it and click on the title of a Panel to edit the settings.
To get more information you can check the URLs below.
References:
https://docs.influxdata.com/influxdb/v1.7/
https://docs.influxdata.com/telegraf/v1.8/
http://docs.grafana.org/guides/getting_started/