I have been experimenting with the Raspberry Pi and the Bosch BME680 and Plantower PMS5003. With the BME680 you can measure temperature, air pressure, humidity, and VOC gas (Volatile Organic Compunds). With the PMS5003 particles can be measured. Also used a Telegraf agent, Influxdb2 and Grafana.
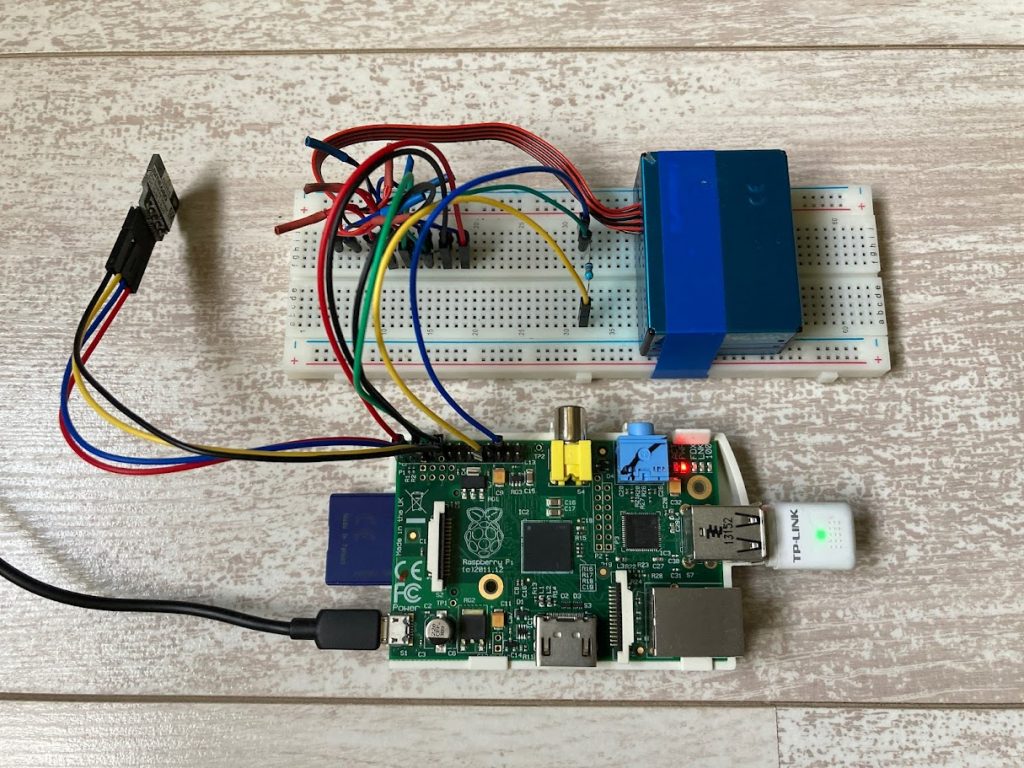
A picture of the experimental setup.
A screenshot of the result in Grafana.
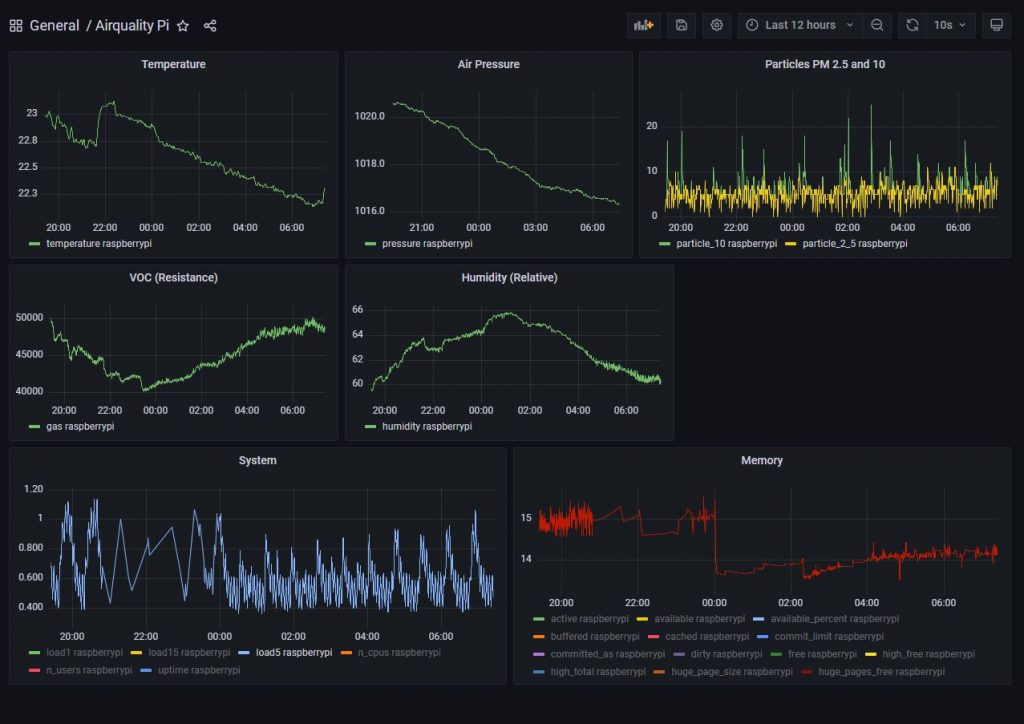
The sensors are being read by a program in Python every 30 seconds. The results are then being written to CSV-files. The CSV-files are being read by a Telegraf agent on the Raspberry Pi. The Telegraf agent then sends the data to an Influxdb database which is being read by the Grafana program. The Influxdb and Grafana are running on a server in AWS.
The queries in Flux in Grafana can be created with the Data Explorer in InfluxDB 2.0.
Example for a query is:
from(bucket: "airquality")
  |> range(start: v.timeRangeStart, stop: v.timeRangeStop)
  |> filter(fn: (r) => r["_measurement"] == "file")
  |> filter(fn: (r) => r["_field"] == "humidity")
  |> filter(fn: (r) => r["host"] == "raspberrypi")
  |> aggregateWindow(every: v.windowPeriod, fn: mean, createEmpty: false)
  |> yield(name: "mean")
The aggregateWindow() function is important to prevent the following error:
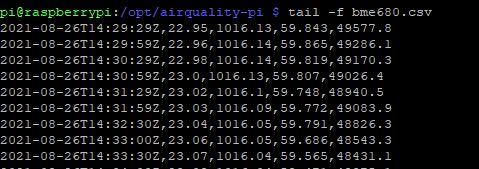
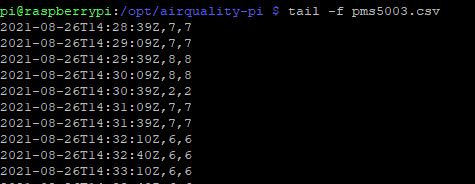
A query returned too many datapoints and the results have been truncated at 4191 points to prevent memory issues. At the current graph size, Grafana can only draw 419. Try using the aggregateWindow() function in your query to reduce the number of points returned.Screenshots of the .CSV files on the Raspberry Pi.
Python snippet to create the CSV-file.
Without the flush() the data will not be written directly to the CSV-file but cached.
f_pms5003 = open("/opt/airquality-pi/pms5003.csv", mode='a+t')
pms.readData()
if pms.data:
    nowutc = datetime.datetime.utcnow()
    date_time = nowutc.strftime('%Y-%m-%dT%H:%M:%SZ')
    pms_output = '{0},{1},{2}'.format(date_time,pms.getPM2_5(),pms.getPM10())
    f_pms5003.write(pms_output + "\n")
    f_pms5003.flush()
Telegraf is running as a systemd service on the Raspberry Pi.
Created a file airquality-pi.service for this:
[Unit]
Description=Airquality Pi
After=network.target

[Service]
Type=simple
User=pi
WorkingDirectory=/opt/airquality-pi
ExecStart=/opt/airquality-pi/airquality-pi.sh

[Install]
WantedBy=multi-user.target
airquality-pi.sh
#!/usr/bin/bash

# Start the airquality script
echo "$(date)"
echo "... Starting airquality ..."
python3 airquality-pi.py
Telegraf file input example. Snippet from the /etc/telegraf.conf
[[inputs.file]]
  files = ["/opt/airquality-pi/bme680.csv"]

  data_format = "csv"
  csv_header_row_count = 0
  csv_column_names = ["timestamp","temperature","pressure","humidity","gas"]
  csv_skip_rows = 0
  csv_skip_columns = 0
  csv_delimiter = ","
  csv_comment = "#"
  csv_trim_space = true
  csv_tag_columns = [""]
  csv_measurement_column = ""
  csv_timestamp_column = "timestamp"
  csv_timestamp_format = "2006-01-02T15:04:05Z"
Also created a logrotate configuration for the CSV-files. Example for bme680.csv.
Create file /etc/logrotate.d/bme680
/opt/airquality-pi/bme680.csv
{
    rotate 5
    daily
    missingok
    dateext
    copytruncate
    notifempty
    compress
}
Version of the used software:
Grafana version: 8.1.1
Influxdb2: 2.0.8
Telegraf: 1.19.2
Raspberry Pi 1B: Raspbian Linux v10
There seem to be quite some projects about measuring airquality with a Raspberry Pi. It appears that the Nova Fitness SDS011 appears the more popular sensor.
References:
https://learn.pimoroni.com/tutorial/sandyj/getting-started-with-bme680-breakout
https://shop.pimoroni.com/products/pms5003-particulate-matter-sensor-with-cable
https://www.raspberrypi.org/blog/monitor-air-quality-with-a-raspberry-pi/
https://www.samenmetenaanluchtkwaliteit.nl/